

A/B testing tools help businesses optimize their websites. Reporting features in these tools provide essential insights.
In today’s competitive market, understanding customer behavior is crucial. A/B testing tools with reporting features offer a way to test and measure the effectiveness of different website elements. They allow you to compare two versions of a webpage to see which one performs better.
The reporting features give detailed insights into user interactions, helping you make data-driven decisions. This can lead to higher conversion rates, better user experience, and more effective marketing strategies. In this blog post, we will explore some of the best A/B testing tools with robust reporting features, helping you choose the right one for your needs. Stay tuned to discover tools that can enhance your business decisions.
Introduction To A/b Testing
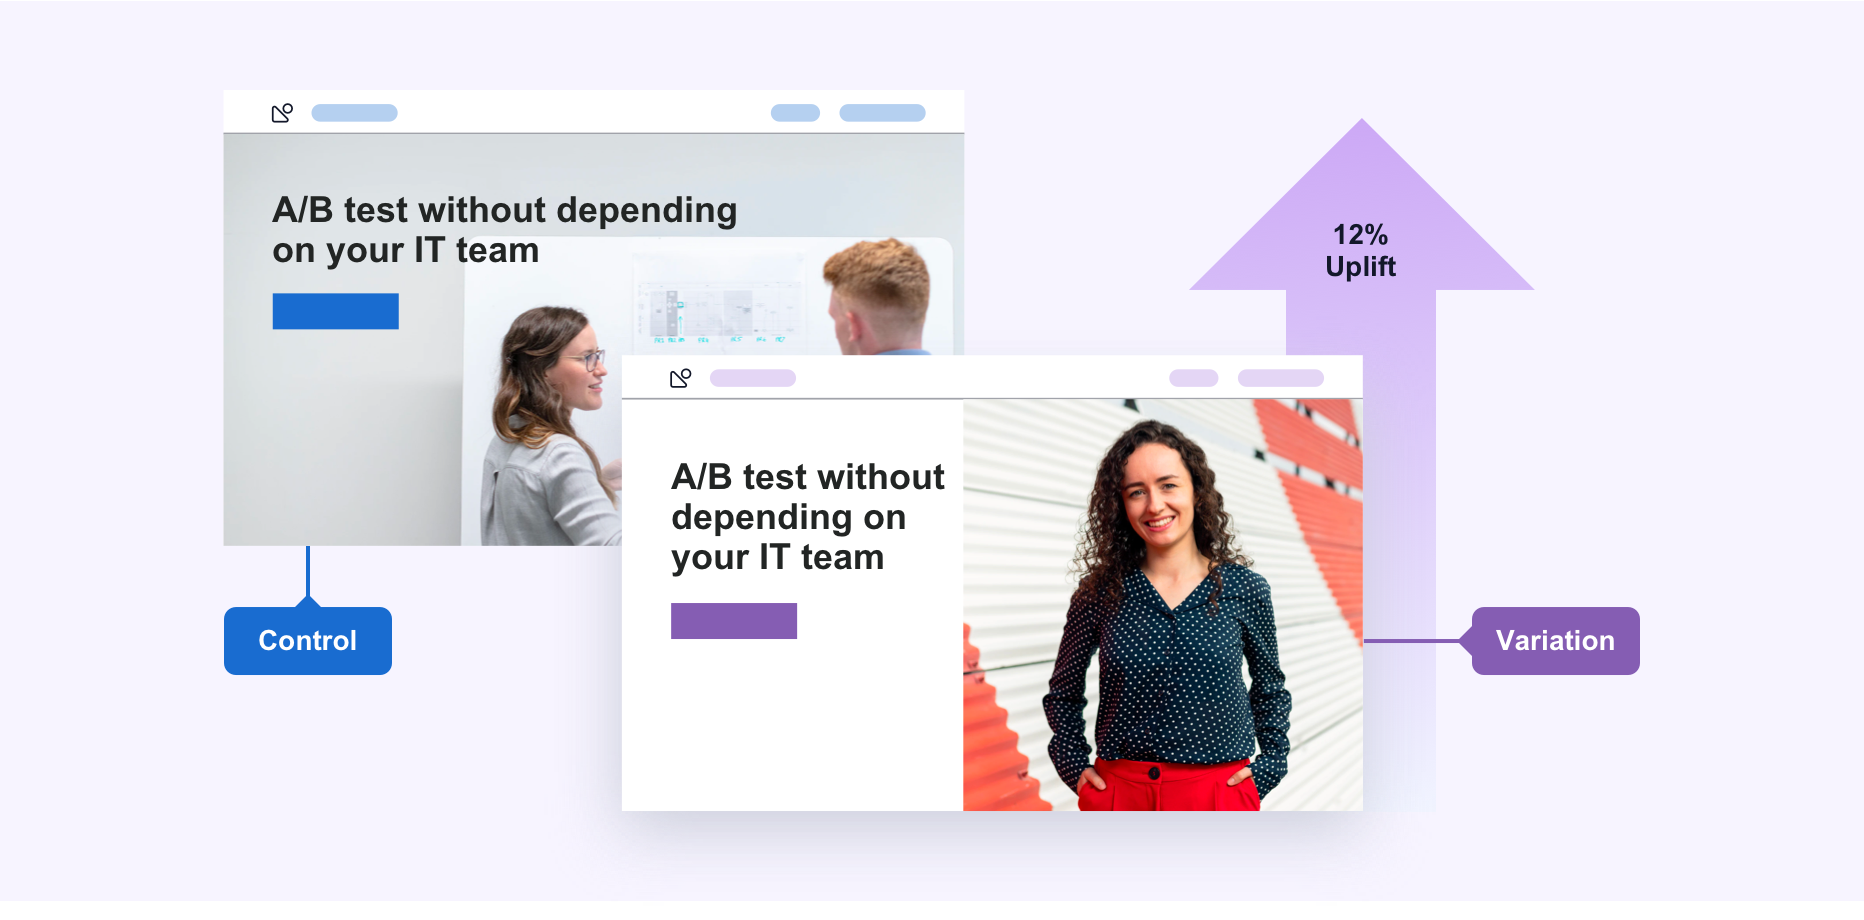
A/B testing is a method used to compare two versions of a webpage or app. This helps determine which version performs better. It involves changing one element and measuring its impact. The goal is to improve user experience and increase conversions.
Importance Of A/b Testing
A/B testing is crucial for optimizing digital content. It helps businesses make data-driven decisions. By testing different versions, companies learn what works best. This can lead to higher engagement and better customer satisfaction.
Here are key benefits of A/B testing:
- Increases conversion rates.
- Improves user experience.
- Reduces bounce rates.
- Provides valuable insights.
How A/b Testing Works
Setting up an A/B test is straightforward. Follow these steps:
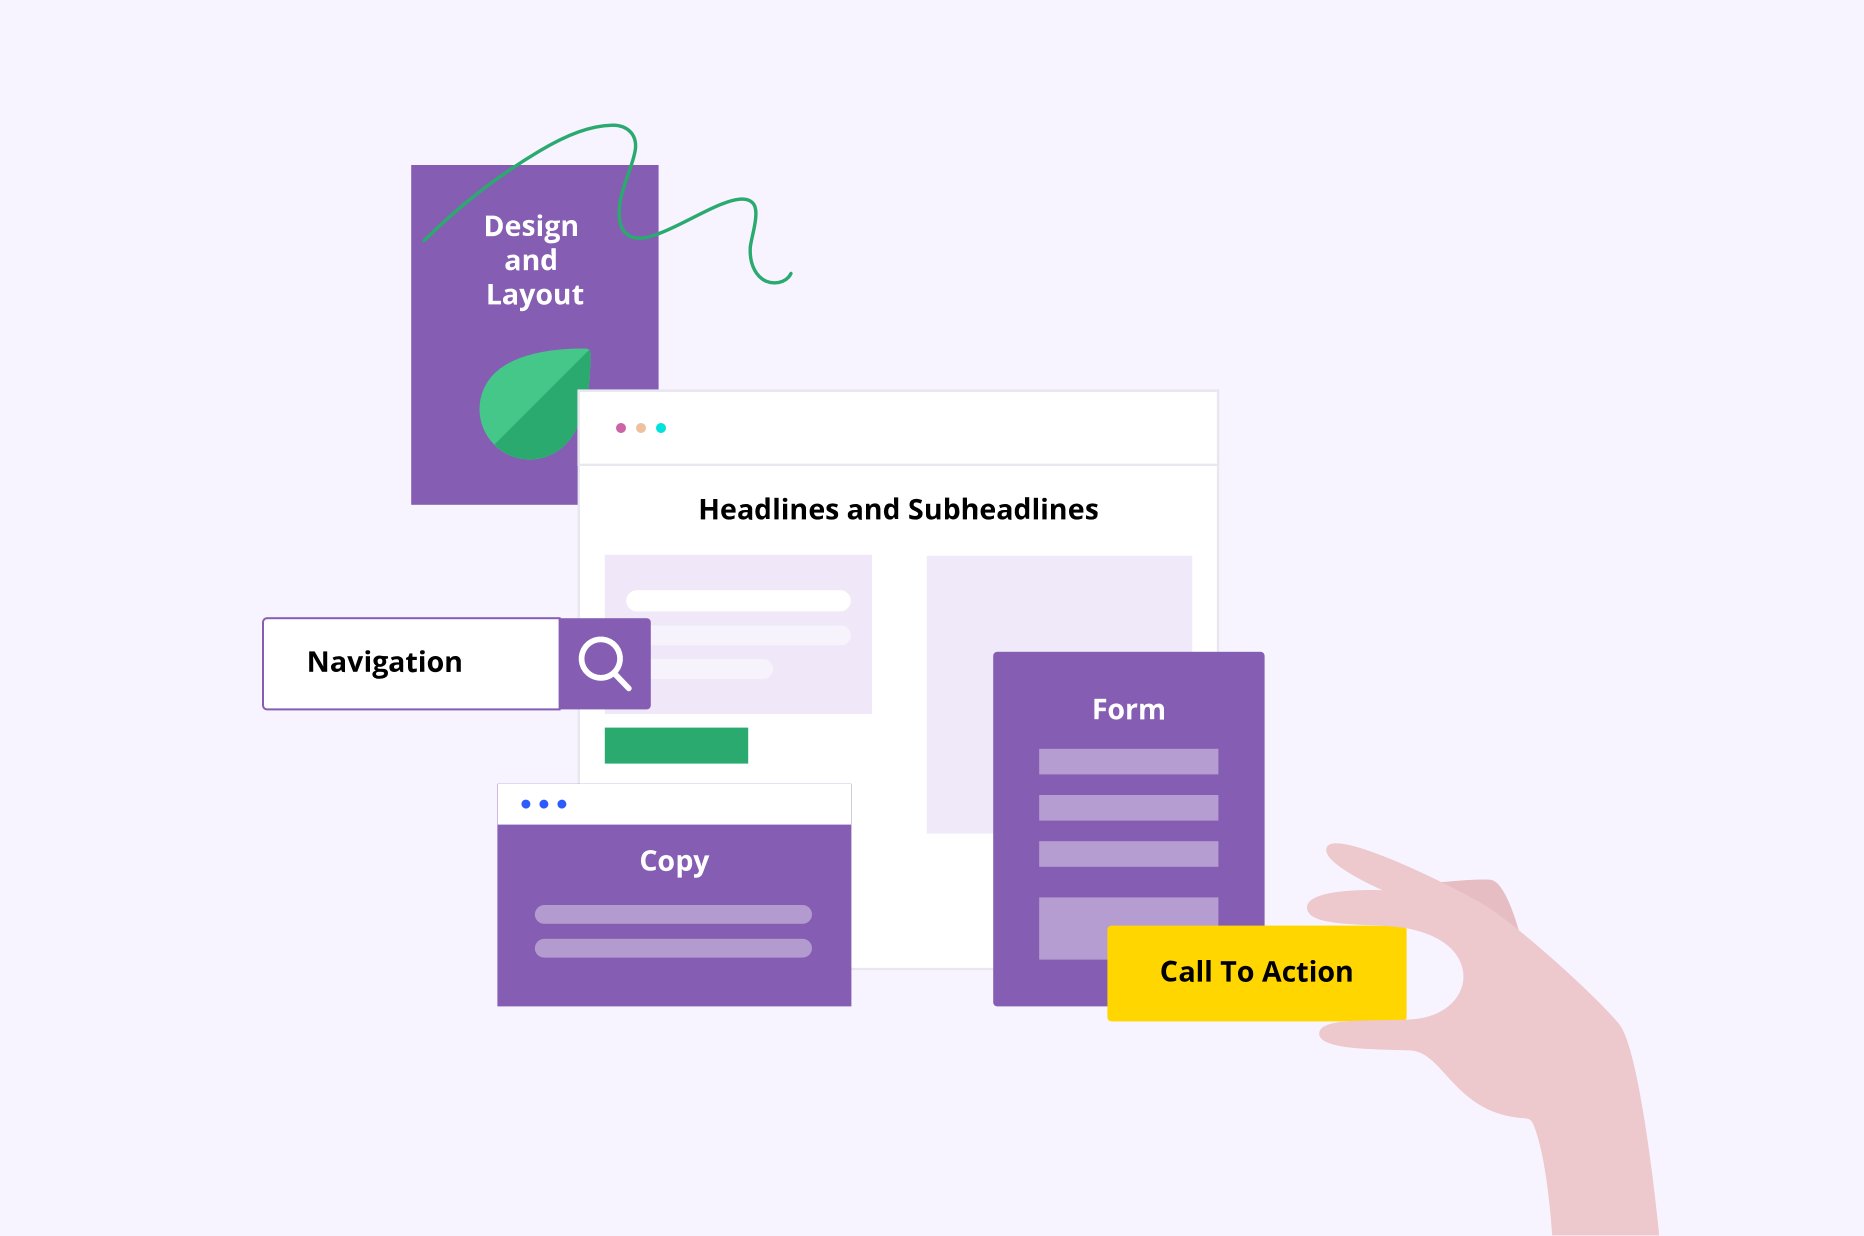
- Identify the element to test (headline, button, image).
- Create two versions (A and B) with one difference.
- Split your audience into two groups.
- Show version A to one group and version B to the other.
- Measure and compare the results.
Tools with reporting features make this process easier. They provide detailed analytics and help in decision making. Some popular tools include:
| Tool | Features | Pricing |
|---|---|---|
| Google Optimize | Integration with Google Analytics, User-friendly interface | Free |
| Optimizely | Advanced targeting, Multivariate testing | Paid |
| VWO | Heatmaps, Session recordings | Paid |
Using these tools can help businesses achieve better results. They simplify the testing process and provide clear insights. This makes it easier to optimize and improve digital content.
Key Features Of A/b Testing Tools
Choosing the right A/B testing tool can be challenging. These tools offer different features to meet various needs. Understanding the key features can help you make an informed decision.
User-friendly Interface
A user-friendly interface is crucial. It makes the tool easy to navigate. This helps beginners and experts alike.
Look for tools with simple dashboards. They should have clear instructions. This reduces the learning curve.
Here are some features to consider:
- Intuitive layout
- Clear navigation menus
- Drag-and-drop functionality
- Real-time previews
Integration Capabilities
Integration capabilities are important. The tool should work with other software. This includes your website, analytics, and CRM systems.
Here are some common integrations:
| Software | Purpose |
|---|---|
| Google Analytics | Track website metrics |
| WordPress | Manage website content |
| Salesforce | Manage customer relationships |
Easy integration saves time. It also ensures smooth data flow between tools.
Top A/b Testing Tools
Choosing the right A/B testing tool is crucial for improving your website’s performance. The right tool can help you make data-driven decisions with confidence. Here are some of the top A/B testing tools that also offer robust reporting features.
Tool 1 Overview
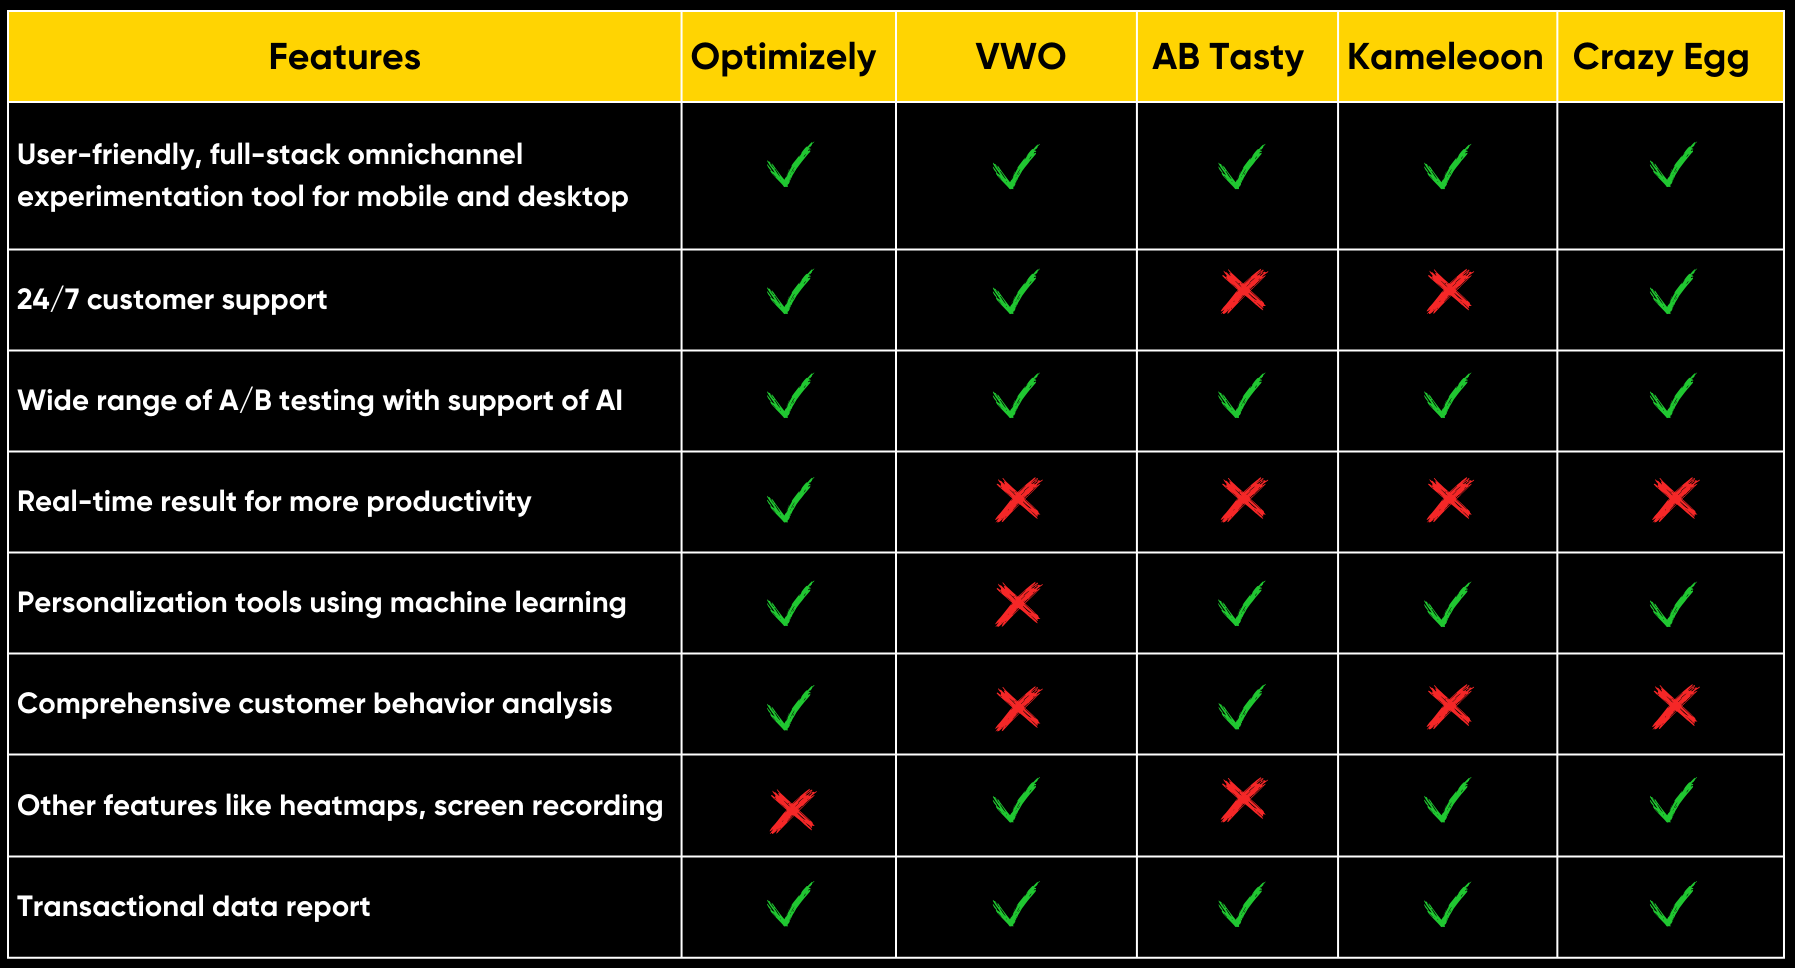
Optimizely is a popular A/B testing tool that provides a user-friendly interface. It offers an intuitive drag-and-drop editor, making it easy to set up tests. Optimizely also provides real-time reporting features, allowing you to see results as they happen.
| Feature | Description |
|---|---|
| Ease of Use | Intuitive drag-and-drop editor |
| Real-time Reporting | See results as they happen |
| Integrations | Works with many analytics tools |
- User-friendly interface
- Supports multiple integrations
- Real-time data
Tool 2 Overview
VWO (Visual Website Optimizer) is another top-tier A/B testing tool. It is known for its comprehensive reporting features. VWO offers heatmaps, session recordings, and detailed analytics to help you understand user behavior.
| Feature | Description |
|---|---|
| Heatmaps | Visualize where users click |
| Session Recordings | See how users interact with your site |
| Detailed Analytics | In-depth data on user behavior |
- Comprehensive reporting features
- Heatmaps for visual insights
- Session recordings to observe user interactions
Credit: niteco.com
Reporting Features In A/b Testing Tools
A/B testing tools are essential for optimizing your website. They help you understand what changes lead to better performance. One key aspect of these tools is the reporting features. Good reports help you make informed decisions. Let’s explore some of these features.
Real-time Data
Real-time data is crucial for effective A/B testing. It allows you to see results as they happen. This feature helps you quickly spot trends and make timely adjustments.
With real-time data, you can:
- Monitor user behavior instantly
- Identify issues without delay
- Adjust tests based on current performance
Many A/B testing tools offer dashboards displaying real-time metrics. These dashboards provide a clear view of how your test variants are performing.
Customizable Reports
Customizable reports allow you to tailor data to your specific needs. These reports help you focus on the metrics that matter most to your business.
Benefits of customizable reports include:
- Highlighting key performance indicators (KPIs)
- Filtering data by specific segments
- Creating visual charts and graphs
You can adjust the reports to show data in various formats. This flexibility makes it easier to share insights with your team.
Tables are also a valuable feature in customizable reports. They help in comparing different test variations side-by-side.
An example table might look like this:
| Test Variant | Conversion Rate | Bounce Rate |
|---|---|---|
| Variant A | 5% | 40% |
| Variant B | 7% | 35% |
Customizable reports enhance the value of your A/B testing efforts. They ensure you get the most relevant insights.
Choosing The Right Tool
Selecting the best A/B testing tool can be overwhelming. There are many options. Each has unique features. The right choice can improve your testing process. It can also provide insights into your audience’s preferences. This section will help you make an informed decision.
Factors To Consider
- Ease of Use: The tool should be user-friendly. Even for beginners.
- Integration: It should integrate with your existing systems. This ensures smooth data flow.
- Reporting Features: Detailed and customizable reports are crucial. They help in analyzing test results effectively.
- Cost: Consider your budget. Some tools offer free trials or tiers. Choose what fits your needs.
- Support: Check the availability of customer support. Good support can resolve issues quickly.
Comparison Of Popular Tools
| Tool | Ease of Use | Integration | Reporting Features | Cost | Support |
|---|---|---|---|---|---|
| Optimizely | High | Wide range | Advanced | $$$ | 24/7 support |
| Google Optimize | Moderate | Google ecosystem | Basic | Free | Limited |
| VWO | High | Various platforms | Comprehensive | $$ | 24/5 support |
| Unbounce | High | Marketing tools | Detailed | $$ | 24/7 support |
These tools offer different features and pricing. Optimizely is known for its advanced reporting features. Google Optimize is great for those on a budget. VWO offers comprehensive integration and support. Unbounce is ideal for marketing teams. Consider what factors are most important to you.
Implementing A/b Tests
Implementing A/B tests helps optimize website performance. It ensures data-driven decisions. This section guides you through setting up, running, and monitoring A/B tests.
Setting Up Tests
Setting up A/B tests involves several steps. First, define your goal. It could be increasing clicks, sign-ups, or sales. Next, identify the variable you want to test. This could be headlines, images, or button colors.
Use a testing tool with reporting features. These tools help track and analyze data. Examples include Google Optimize and Optimizely.
| Tool | Features |
|---|---|
| Google Optimize | Free, integrates with Google Analytics |
| Optimizely | Advanced targeting, robust reporting |
Once you select a tool, create variations of your webpage. Ensure each variation focuses on the variable you want to test. Finally, set the test duration. A typical test runs for at least two weeks.
Running And Monitoring Tests
Running A/B tests requires careful attention. Start by launching the test through your chosen tool. Ensure the traffic is evenly split between variations. This ensures accurate results.
Monitor the test regularly. Check for any technical issues. Track key metrics like click-through rates, bounce rates, and conversion rates. Use the reporting features of your tool to gather insights.
Here are steps to follow:
- Launch the test.
- Split traffic evenly.
- Monitor for issues.
- Track key metrics.
- Gather insights.
Adjust your strategy based on the data collected. This helps refine your approach and achieve better results.
Analyzing A/b Test Results
A/B testing is a powerful method to improve your website’s performance. It helps you understand what works best for your audience. But, the true value of A/B testing lies in the analysis of the results. In this section, we’ll explore how to interpret data and draw conclusions from your A/B test results.
Interpreting Data
Interpreting data is the first step in analyzing A/B test results. Data interpretation involves understanding how your test performed. Look at key metrics like conversion rates, bounce rates, and time on page.
Use a table to organize your data for easy comparison:
| Metric | Version A | Version B |
|---|---|---|
| Conversion Rate | 12% | 15% |
| Bounce Rate | 45% | 40% |
| Time on Page | 1:30 | 2:00 |
Analyze these metrics to see which version performed better. Look for significant differences. Use statistical significance to ensure your results are not due to chance.
Drawing Conclusions
Drawing conclusions is the next step after interpreting your data. Based on the metrics, decide which version performed better. Consider why one version outperformed the other.
- Did the change in the call-to-action increase conversions?
- Did the new design reduce the bounce rate?
- Did the content update keep visitors longer on the page?
Use these insights to make data-driven decisions. Implement the winning version on your site. Continue testing to keep improving.
A/B testing is an ongoing process. Regular analysis helps refine your strategies. It ensures your website meets your audience’s needs.
Case Studies
Case studies are essential for understanding the impact of A/B testing tools. They provide real-world examples of how businesses use these tools to improve their websites. This section will highlight successful A/B tests and lessons learned from them.
Successful A/b Tests
Many companies have seen significant improvements using A/B testing tools. Below are a few case studies:
| Company | Tested Element | Result |
|---|---|---|
| Company A | Homepage CTA | 20% increase in sign-ups |
| Company B | Product Page Layout | 15% boost in conversions |
| Company C | Checkout Process | 30% reduction in cart abandonment |
Lessons Learned
These case studies offer valuable insights. Here are some key lessons:
- Test One Element at a Time: Focus on one variable to get clear results.
- Use Clear Metrics: Define success metrics before starting the test.
- Gather Enough Data: Ensure your sample size is large enough for accurate results.
- Iterate Based on Findings: Use test results to make informed changes and keep improving.
Best Practices For A/b Testing
A/B testing tools with reporting features can help you make informed decisions. These tools allow you to compare different versions of a web page or app. Following best practices is key to getting accurate results.
Common Mistakes To Avoid
Making mistakes during A/B testing can lead to incorrect conclusions. Here are some common pitfalls to avoid:
- Testing too many variables at once: Focus on one change at a time for clear results.
- Short test duration: Run tests long enough to gather sufficient data.
- Ignoring statistical significance: Ensure results are statistically significant before making decisions.
- Not segmenting audience: Different user segments may react differently to changes.
Tips For Success
Following these tips can help you conduct successful A/B tests:
- Set clear goals: Know what you want to achieve before starting the test.
- Use a hypothesis: Formulate a hypothesis to guide your test.
- Randomize samples: Ensure your test groups are randomly assigned.
- Track key metrics: Focus on metrics that matter to your business.
- Analyze results carefully: Take time to analyze the data and draw accurate conclusions.
Using A/B testing tools with reporting features can greatly enhance your ability to improve your website or app. Just remember to avoid common mistakes and follow best practices for the best results.
Credit: vwo.com
Credit: vwo.com
Frequently Asked Questions
What Is A/b Testing In Marketing?
A/B testing compares two versions of a webpage or app to see which performs better. It helps in making data-driven decisions.
Why Use A/b Testing Tools?
A/B testing tools simplify the process of comparing versions. They provide insights to improve conversion rates and user experience.
What Features Should A/b Testing Tools Have?
A/B testing tools should have easy setup, reliable reporting, and robust analytics. They should also offer segmentation and integration capabilities.
How Do Reporting Features Enhance A/b Testing?
Reporting features provide detailed insights into test results. They help identify trends and areas for improvement, ensuring data-driven decisions.
Conclusion
Choosing the right A/B testing tool is crucial for your success. Good reporting features help you understand results better. They guide your decisions and improve your strategies. Explore different tools and find what fits your needs best. Focus on those that offer clear, detailed reports.
This way, your testing efforts become more effective. Remember, better data leads to better outcomes. Keep experimenting and learning. A/B testing is a continuous process. Stay informed and keep optimizing. Your efforts will pay off in the long run.
